Skip to content Skip to sidebar Skip to footer
Crop Scouting by Drone in Manitoba: How the Mavic 3M Helps Find Problems Earlier | Vantage Drones
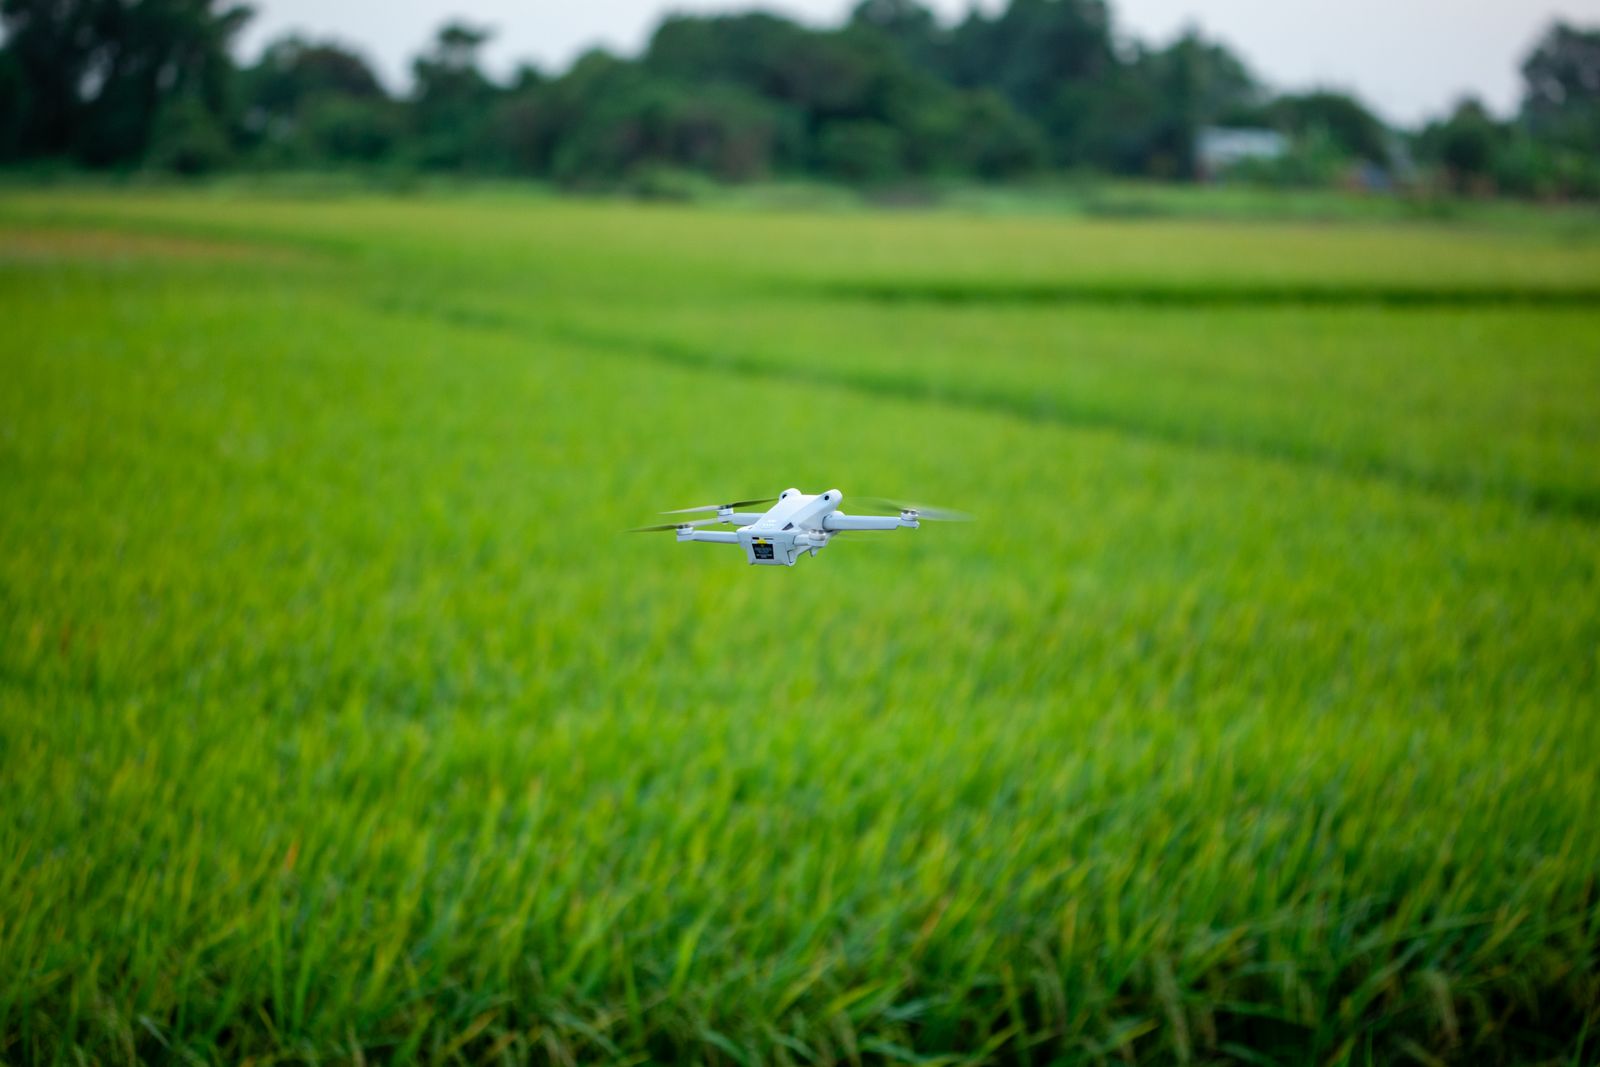
A drone hovering above a vibrant green agricultural field
Agriculture · Crop Scouting & Mapping

Crop Scouting by Drone in Manitoba: How the Mavic 3M Helps Find Problems Earlier

A field can look fine from the grid road while parts of it are falling behind. Here's what drone-based mapping can show you, in plain terms, and where it fits before you make a decision.

August 2026 Vantage Drones 10 min read

What Crop Scouting by Drone Actually Looks Like

Walking a field still works. It just doesn't cover everything, and it can miss a problem until that problem has already cost yield.

Most fields don't have one big problem. They have several small ones scattered across acres that all look about the same from the truck window. A grower checking a quarter section on foot can only sample a few spots and assume the rest matches. That's normal, practical scouting — but a wet corner two rows over, or a stressed patch behind a shelterbelt, is easy to walk right past. By the time it's visible from the road, the cheapest window to fix it has often already closed.

A Mavic 3M flight covers the whole field in minutes, not just a sample of it. Vantage crews fly a planned route over the field, and the drone returns a complete, geotagged picture of every acre — not an impression of it. That picture becomes the starting point for a scouting trip, not a replacement for one. It tells an agronomist exactly where to walk, instead of leaving them to guess.
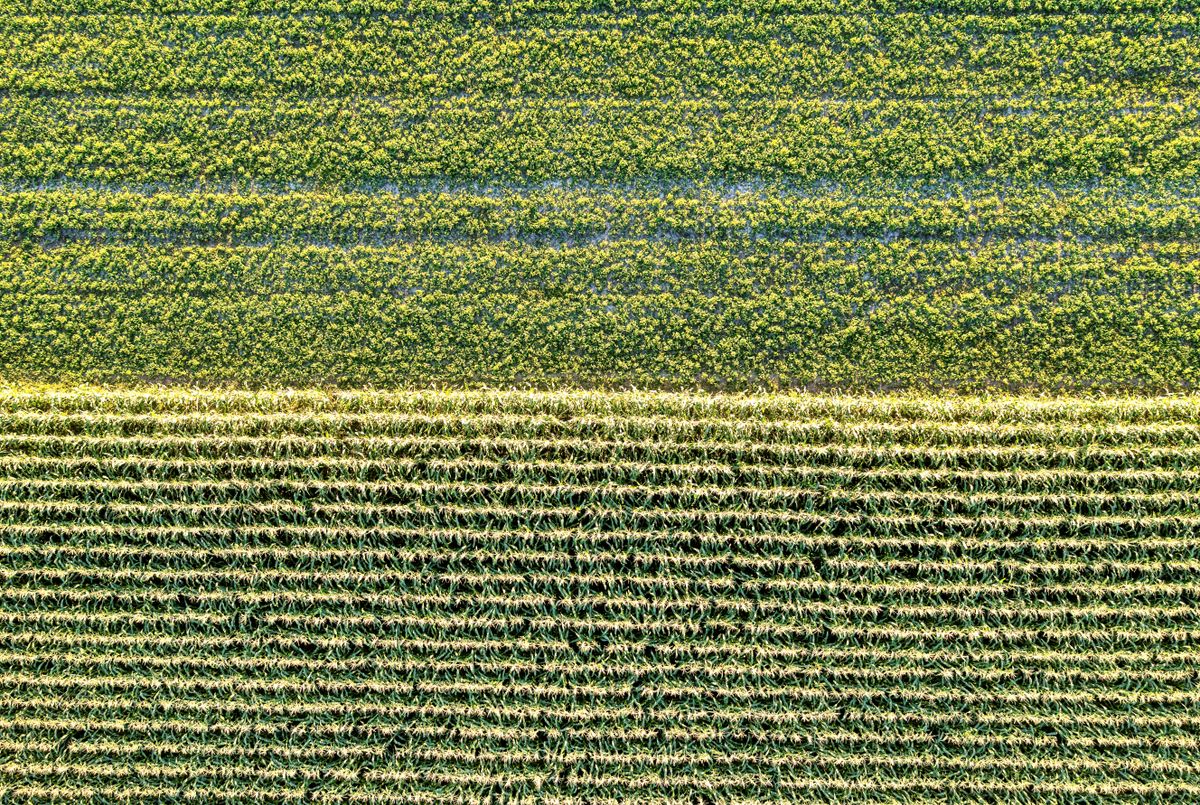
Aerial photography of green crop field showing agricultural patterns
One overhead pass covers what would take hours to walk, and it doesn't miss the corners. Photo: Tom Fisk / Pexels

How a Mapping Flight Works, Start to Finish

A mapping flight follows the same six steps every time, whether it's one field or a whole operation.

1Plan 2Fly 3Process 4Map 5Ground-Truth 6Act
Ground-truthing is the pivot point — the step where a map turns into a confirmed answer. (Original diagram, Vantage Drones)

The flight area is planned first, usually matched to a field boundary. The drone then flies that route at a set altitude, capturing overlapping images. Vantage processes that imagery, typically using DJI Terra, into one stitched map of the field, including any vegetation index map that's needed. From there, a grower or agronomist reviews the map, checks the zones that look different from the rest of the field, and walks those zones to confirm what's actually happening before deciding what to do. A later flight over the same field can be compared to the first one, so a single map turns into a record of how those zones changed over the season.

1

Altitude and detail

Flying higher covers more field per battery, but each pixel represents more ground. A broad overview can fly higher; catching early emergence gaps needs a lower, more detailed pass.

2

Image overlap

The software stitches hundreds of photos into one map, and needs enough overlap between them to do it cleanly — usually 70–80% front overlap and 60–70% side overlap.

3

Following the terrain

The Mavic 3M holds a steady height above the crop itself, not above sea level. That matters on rolling ground, and in orchard or vineyard rows where canopy height changes row to row.

4

Light calibration

Light changes through the day. A quick reference shot before takeoff keeps the numbers consistent, so one week's map can be fairly compared to the next.

Why a Normal Drone Photo Isn't the Whole Story

A standard camera, or a person walking the field, sees a crop the way it looks: green, upright, seemingly fine. Plant stress usually changes how a leaf reflects light before it changes how the plant looks to the eye. That gap is what multispectral imaging is built to catch.

The Mavic 3M carries two cameras at once: a 20-megapixel RGB camera for a normal field photo, and a four-band multispectral camera that also records green, red, red edge, and near-infrared light. Healthy, actively growing plants reflect near-infrared light strongly and absorb red light. Stressed or thinning plants do this less. Put those bands together and you get an NDVI map — a colour-coded picture of relative plant vigour across the whole field, something a regular photo can't show.

NDVI  =  (NIR − Red) / (NIR + Red)

Dense, healthy canopy reflects a lot of near-infrared and little red light, producing a high NDVI value. Bare soil, water, and thin or stressed canopy produce lower values.

RGB VIEW Looks uniformly healthy from above NDVI MULTISPECTRAL VIEW Shows the stress zones hiding underneath
A simplified illustration. A real NDVI map is a precise, per-pixel picture built in DJI Terra or SmartFarm from the raw multispectral bands. (Original diagram, Vantage Drones)

None of this is automatic diagnosis. NDVI is a strong early-season indicator of biomass and general vigour, but it can flatten out once a canopy closes in. That's where two other indices help: GNDVI, which is more sensitive to chlorophyll and nitrogen status, and NDRE, which uses the red edge band and keeps working later in the season when NDVI starts to lose sensitivity. The Mavic 3M's software can build all three from the same flight, so an agronomist isn't limited to one view of the field.

The Mavic 3M's RTK module also tags every image with centimetre-level position data. That means the map lines up precisely with the field boundary, and the same flight path can be repeated later to compare one date against another.

What the Maps Actually Reveal

Once a flight is processed into a map, a handful of patterns tend to stand out. None of these are automatic diagnoses on their own — they're patterns worth checking on the ground.

01

Wet spots and drainage

Low corners and old waterways hold moisture longer than the rest of the field. They show up as low-vigour zones that line up closely with elevation, and tend to repeat in the same spots year after year.

02

Emergence gaps

Planter skips, seed placement issues, or compaction from equipment traffic show up as thin or missing stands in the earliest flights of the season, well before they're visible walking the rows.

03

Stress zones

Nutrient shortfalls, early disease, and insect pressure can reduce how a canopy reflects light before visible symptoms appear. The map narrows down where to look; it doesn't name the cause on its own.

04

Uneven growth

Sandy knolls, heavy clay pockets, and old fence lines create yield variability that's easy to write off as "just how that corner is." A season of mapped data usually shows a clearer, repeatable pattern.
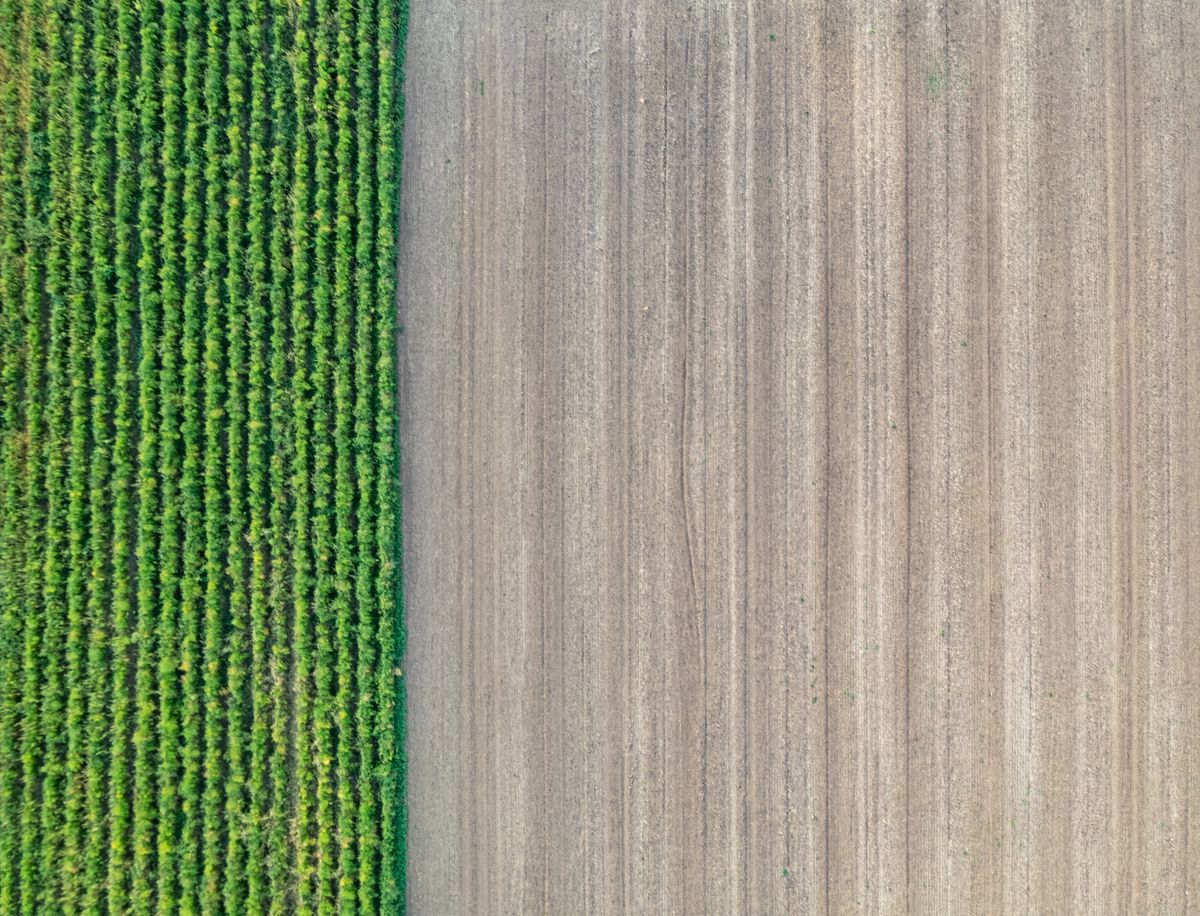
Aerial view showing contrasting green crops and tilled brown soil highlighting field variability
Variability like this is often visible once it's severe. Multispectral mapping catches the same pattern while it's still mild. Photo: Bernd Dittrich / Pexels

Why Drone Imagery Can Be More Timely Than Satellite

Satellite-based NDVI has been available to growers for years, and it's genuinely useful for a broad, season-long view. It needs no flight time and covers large areas automatically. But it comes with limits that a drone flight doesn't have.

SATELLITE Revisits every 5–16 days Blocked entirely by cloud cover Coarse resolution, 3–10 m per pixel Good for season-long trend tracking MAVIC 3M Flies whenever the field needs it Flies under cloud, unaffected by it Centimetre-level resolution Good for in-season, act-now decisions
The two aren't really competing. Satellite is best for the season-long trend line; drone is best for the decision you need to make this week. (Original diagram, Vantage Drones)

Manitoba's growing season doesn't leave much room for a five- to sixteen-day gap between clear satellite images, especially when the province regularly clouds over during the exact week a grower needs to check a field. A Mavic 3M flight happens on the operation's own schedule, and it resolves detail — a single planter pass, a small wet pocket, a compacted headland — well below what a satellite pixel can show. In practice, the two work well together: satellite for the broad, repeatable picture across an operation, and a drone flight when one field or one problem needs a closer look before a decision gets made.

From Map to Action: What a Map Is Actually For

A map on its own doesn't fix anything. Its value comes from what it changes about how a grower spends time and makes decisions — and this is where the Mavic 3M connects directly to the rest of a Vantage operation.

For growers running, or considering, the Agras spray fleet, an NDVI map becomes the prescription: stress zones and weed patches spotted from the air load directly into a variable-rate spray mission, so product goes only where the map says it's needed. For growers not spraying by drone yet, the same map still pays for itself. It turns a scouting trip into a targeted walk to two or three flagged coordinates, instead of a guess-and-check pass across the whole field.

Feeds spray prescriptions

NDVI output loads directly into a variable-rate spray mission for targeted application on the T25, T50, or T100.

Sharpens ground scouting

Turns a full-field walk into a short list of coordinates that are actually worth checking in person.

Builds a field record

Repeat flights on the same coordinates show whether a problem zone is improving, worsening, or holding steady year over year.

Documents field conditions

A dated, geotagged map is useful on its own for insurance conversations or agronomic records, separate from any spray decision.

You don't need to be ready to spray by drone to get value from flying one. Mapping is often the first step, and for a lot of Manitoba operations, it's the one that pays for itself fastest.

Common Mistakes When Using Drone Imagery

Most of the disappointment growers report with drone mapping comes down to a short list of avoidable mistakes, not the technology itself.

01

Assuming every colour difference means a crop problem. A field map shows variability, not automatically a diagnosis. Shadows, residue, soil type, and even the time of day a flight was taken can create differences that have nothing to do with plant health.

02

Treating an index map as a diagnosis. NDVI and similar indices flag where something is different. They don't identify disease, a nutrient gap, or moisture stress on their own — that call still needs a ground check.

03

Skipping the ground visit. A map is the start of the process, not the end of it. Skipping the walk defeats the point of narrowing down where to look in the first place.

04

Flying without a clear question. A flight with no specific purpose tends to produce a map that gets looked at once and forgotten. Mapping earns its value when there's something specific to check.

The DJI Mavic 3M at a Glance

The Mavic 3M is genuinely portable. It folds down small enough to fit in an ordinary field bag, and one operator can be airborne within minutes of pulling up to a field.

951 gTake-off weight (with RTK)
20 MPRGB camera resolution
4-bandG / R / Red Edge / NIR multispectral
~43 minMax flight time per battery
~200 haCoverage in a single flight
RTKCentimetre-level positioning

Specifications reflect DJI Agriculture manufacturer data for the Mavic 3 Multispectral Edition. Actual coverage per flight varies with altitude, overlap settings, and wind.

Because RGB and multispectral data are captured in the same pass, there's no need for a separate mapping flight. One mission over a field produces both the visual record and the vegetation-index data an agronomist needs to act on.

Buying the Mavic 3M in Canada

Growers who want to run mapping in-house, rather than booking a Vantage flight crew, can order a Mavic 3M through the Vantage Drones shop. It's listed at $5,945 and ships as a complete kit: the drone with its RTK module, a DJI RC Pro Industry controller, an intelligent flight battery with charging hub, propellers, a gimbal guard, and a quick start guide.

Larger operations sometimes add a D-RTK 2 Base Station for a fixed, high-accuracy reference point across a season of flights. It isn't required — the Mavic 3M's onboard RTK already supports mapping without ground control points — but it tightens repeatability for operations tracking the same coordinates flight after flight.

Flight data moves into DJI Terra or SmartFarm Web to build the NDVI, GNDVI, and NDRE maps, and from there into a variable-rate prescription — the same path that connects a Mavic 3M mapping flight to an Agras spray mission. As an authorized DJI Enterprise reseller, Vantage backs every unit sold in Canada with local warranty support, on-site training, and financing options for operations that would rather spread the cost across a season.

See What's Actually Happening in Your Fields

Book a mapping demo on your own acres, or talk to us about whether mapping or spraying is the right place to start.

.hero-photo{ position:absolute; inset:0; width:100%; height:100%; object-fit:cover; opacity:0.55; } .hero-scrim{ position:absolute; inset:0; background:linear-gradient(180deg, rgba(20,20,20,0.55) 0%, rgba(20,20,20,0.75) 55%, rgba(20,20,20,0.95) 100%), linear-gradient(90deg, rgba(167,34,31,0.35) 0%, rgba(20,20,20,0.1) 45%); } .hero .wrap{position:relative;z-index:2;} .eyebrow{ display:inline-block; color:var(--red); background:var(--white); font-size:13px; font-weight:700; letter-spacing:0.14em; text-transform:uppercase; margin-bottom:18px; padding:5px 10px; } h1{ font-size:38px; line-height:1.15; margin:0 0 18px; font-weight:800; letter-spacing:-0.01em; text-shadow:0 2px 14px rgba(0,0,0,0.4); } .hero p.lede{ font-size:18px; color:#F0EEEC; max-width:560px; margin:0 0 30px; text-shadow:0 1px 10px rgba(0,0,0,0.4); } .hero-meta{ display:flex; gap:24px; font-size:13px; color:#D8D6D4; border-top:1px solid rgba(255,255,255,0.25); padding-top:18px; } /* Section headings */ section{padding:52px 0;} section.alt{background:var(--grey-bg);} h2{ font-size:26px; font-weight:800; color:var(--black); margin:0 0 18px; letter-spacing:-0.01em; padding-left:14px; border-left:5px solid var(--red); } h3{ font-size:18px; font-weight:700; color:var(--red-dark); margin:28px 0 8px; } p{color:var(--grey-text);font-size:16px;margin:0 0 16px;} .lead-line{font-size:18px;color:var(--black);font-weight:500;} strong{color:var(--black);} a.inline-link{color:var(--red);text-decoration:underline;} /* Pull quote */ .pullquote{ border-left:4px solid var(--red); padding:6px 0 6px 20px; margin:28px 0; font-size:19px; font-weight:600; color:var(--black); } /* Photo figures */ figure{margin:26px auto;text-align:center;} figure.photo img{ width:70%; height:380px; object-fit:cover; display:block; margin:0 auto; border:1px solid var(--grey-line); } figcaption{font-size:12.5px;color:#8A8886;margin-top:8px;} figcaption .credit{color:#B3B1AF;} /* Comparison table */ table{width:100%;border-collapse:collapse;margin:22px 0 8px;font-size:14.5px;} thead th{ background:var(--red); color:var(--white); text-align:left; padding:12px 14px; font-weight:700; letter-spacing:0.02em; } tbody td{ padding:12px 14px; border-bottom:1px solid var(--grey-line); color:var(--grey-text); } tbody tr:nth-child(odd){background:#FBFAF9;} tbody td:first-child{color:var(--black);font-weight:700;white-space:nowrap;} .table-caption{font-size:12.5px;color:#8A8886;margin-top:6px;} /* Formula callout */ .formula-box{ background:var(--grey-bg); border:1px solid var(--grey-line); text-align:center; padding:18px; margin:22px 0; font-weight:700; font-size:18px; color:var(--black); letter-spacing:0.01em; } /* Card grids ("smart art" replacement for bullet lists) */ .card-grid{display:grid;grid-template-columns:1fr 1fr;gap:16px;margin:24px 0 8px;} .info-card{border:1px solid var(--grey-line);background:var(--white);padding:20px;} section.alt .info-card{background:var(--white);} .info-card .icon-badge{width:34px;height:34px;background:var(--red);color:var(--white);display:flex;align-items:center;justify-content:center;font-weight:800;font-size:14px;margin-bottom:12px;} .info-card h4{margin:0 0 8px;font-size:15.5px;color:var(--black);font-weight:700;} .info-card p{margin:0;font-size:14.5px;} @media(max-width:640px){.card-grid{grid-template-columns:1fr;}} /* Numbered mistake cards */ .mistake-grid{display:grid;grid-template-columns:1fr;gap:0;margin:22px 0;border-top:1px solid var(--grey-line);} .mistake-card{display:flex;gap:18px;padding:18px 0;border-bottom:1px solid var(--grey-line);align-items:flex-start;} .mistake-card .num{font-family:"Helvetica Neue", Arial, sans-serif;font-weight:800;font-size:22px;color:var(--red);flex-shrink:0;width:38px;} .mistake-card p{margin:0;} /* Two column fit/no-fit */ .fit-grid{display:grid;grid-template-columns:1fr 1fr;gap:0;margin-top:26px;border:1px solid var(--grey-line);} .fit-col{padding:22px 24px;} .fit-col.yes{border-right:1px solid var(--grey-line);} .fit-head{font-weight:800;font-size:14px;letter-spacing:0.08em;text-transform:uppercase;margin-bottom:12px;padding-bottom:10px;border-bottom:2px solid;} .fit-col.yes .fit-head{color:var(--red);border-color:var(--red);} .fit-col.no .fit-head{color:var(--black);border-color:var(--black);} .fit-col p{margin-bottom:12px;font-size:15px;} @media(max-width:640px){.fit-grid{grid-template-columns:1fr;}.fit-col.yes{border-right:none;border-bottom:1px solid var(--grey-line);}} /* Spec cards */ .spec-grid{display:grid;grid-template-columns:repeat(3,1fr);gap:14px;margin:24px 0 8px;} .spec-card{border:1px solid var(--grey-line);padding:16px;text-align:center;} .spec-card .num{color:var(--red);font-weight:800;font-size:22px;display:block;} .spec-card .lbl{font-size:12px;color:var(--grey-text);text-transform:uppercase;letter-spacing:0.05em;margin-top:4px;display:block;} @media(max-width:640px){.spec-grid{grid-template-columns:1fr 1fr;}} /* FAQ accordion */ .faq-list{margin:22px 0;border-top:1px solid var(--grey-line);} .faq-item{border-bottom:1px solid var(--grey-line);padding:16px 0;} .faq-item summary{cursor:pointer;font-weight:700;color:var(--black);font-size:15.5px;list-style:none;position:relative;padding-right:24px;} .faq-item summary::-webkit-details-marker{display:none;} .faq-item summary::after{content:"+";position:absolute;right:0;top:0;color:var(--red);font-weight:800;font-size:18px;} .faq-item[open] summary::after{content:"–";} .faq-item .a{margin-top:10px;font-size:14.5px;color:var(--grey-text);} /* CTA band */ .cta-band{background:var(--red);color:var(--white);padding:52px 0;text-align:center;} .cta-band h2{color:var(--white);font-size:28px;border-left:none;padding-left:0;} .cta-band p{color:#FBE3E2;max-width:520px;margin:0 auto 26px;font-size:16px;} .btn{display:inline-block;background:var(--black);color:var(--white);font-weight:700;padding:15px 34px;text-decoration:none;letter-spacing:0.02em;border:2px solid var(--black);} .btn:hover{background:transparent;border-color:var(--white);} .btn-row{display:flex;gap:14px;justify-content:center;flex-wrap:wrap;} .btn-outline{display:inline-block;background:transparent;color:var(--white);font-weight:700;padding:15px 34px;text-decoration:none;letter-spacing:0.02em;border:2px solid var(--white);} .btn-outline:hover{background:var(--white);color:var(--red);} footer{background:var(--black);color:#9C9A98;padding:30px 0;font-size:13px;} footer .wrap{display:flex;justify-content:space-between;flex-wrap:wrap;gap:12px;} footer strong{color:var(--white);} .credits{background:var(--white);padding:34px 0;border-top:1px solid var(--grey-line);} .credits h4{font-size:12px;text-transform:uppercase;letter-spacing:0.1em;color:#8A8886;margin:0 0 12px;font-weight:700;} .credits ul{margin:0;padding:0;list-style:none;} .credits li{font-size:12.5px;color:#8A8886;padding:5px 0;border-bottom:1px dotted var(--grey-line);} .credits a{color:#8A8886;}
A drone hovering above a vibrant green agricultural field
Agriculture · Crop Scouting & Mapping

Crop Scouting by Drone in Manitoba: How the Mavic 3M Helps Find Problems Earlier

A field can look fine from the grid road while parts of it are falling behind. Here's what drone-based mapping can show you, in plain terms, and where it fits before you make a decision.

August 2026 Vantage Drones 10 min read

What Crop Scouting by Drone Actually Looks Like

Walking a field still works. It just doesn't cover everything, and it can miss a problem until that problem has already cost yield.

Most fields don't have one big problem. They have several small ones scattered across acres that all look about the same from the truck window. A grower checking a quarter section on foot can only sample a few spots and assume the rest matches. That's normal, practical scouting — but a wet corner two rows over, or a stressed patch behind a shelterbelt, is easy to walk right past. By the time it's visible from the road, the cheapest window to fix it has often already closed.

A Mavic 3M flight covers the whole field in minutes, not just a sample of it. Vantage crews fly a planned route over the field, and the drone returns a complete, geotagged picture of every acre — not an impression of it. That picture becomes the starting point for a scouting trip, not a replacement for one. It tells an agronomist exactly where to walk, instead of leaving them to guess.

Aerial photography of green crop field showing agricultural patterns
One overhead pass covers what would take hours to walk, and it doesn't miss the corners. Photo: Tom Fisk / Pexels

How a Mapping Flight Works, Start to Finish

A mapping flight follows the same six steps every time, whether it's one field or a whole operation.

1Plan 2Fly 3Process 4Map 5Ground-Truth 6Act
Ground-truthing is the pivot point — the step where a map turns into a confirmed answer. (Original diagram, Vantage Drones)

The flight area is planned first, usually matched to a field boundary. The drone then flies that route at a set altitude, capturing overlapping images. Vantage processes that imagery, typically using DJI Terra, into one stitched map of the field, including any vegetation index map that's needed. From there, a grower or agronomist reviews the map, checks the zones that look different from the rest of the field, and walks those zones to confirm what's actually happening before deciding what to do. A later flight over the same field can be compared to the first one, so a single map turns into a record of how those zones changed over the season.

1

Altitude and detail

Flying higher covers more field per battery, but each pixel represents more ground. A broad overview can fly higher; catching early emergence gaps needs a lower, more detailed pass.

2

Image overlap

The software stitches hundreds of photos into one map, and needs enough overlap between them to do it cleanly — usually 70–80% front overlap and 60–70% side overlap.

3

Following the terrain

The Mavic 3M holds a steady height above the crop itself, not above sea level. That matters on rolling ground, and in orchard or vineyard rows where canopy height changes row to row.

4

Light calibration

Light changes through the day. A quick reference shot before takeoff keeps the numbers consistent, so one week's map can be fairly compared to the next.

Why a Normal Drone Photo Isn't the Whole Story

A standard camera, or a person walking the field, sees a crop the way it looks: green, upright, seemingly fine. Plant stress usually changes how a leaf reflects light before it changes how the plant looks to the eye. That gap is what multispectral imaging is built to catch.

The Mavic 3M carries two cameras at once: a 20-megapixel RGB camera for a normal field photo, and a four-band multispectral camera that also records green, red, red edge, and near-infrared light. Healthy, actively growing plants reflect near-infrared light strongly and absorb red light. Stressed or thinning plants do this less. Put those bands together and you get an NDVI map — a colour-coded picture of relative plant vigour across the whole field, something a regular photo can't show.

NDVI  =  (NIR − Red) / (NIR + Red)

Dense, healthy canopy reflects a lot of near-infrared and little red light, producing a high NDVI value. Bare soil, water, and thin or stressed canopy produce lower values.

RGB VIEW Looks uniformly healthy from above NDVI MULTISPECTRAL VIEW Shows the stress zones hiding underneath
A simplified illustration. A real NDVI map is a precise, per-pixel picture built in DJI Terra or SmartFarm from the raw multispectral bands. (Original diagram, Vantage Drones)

None of this is automatic diagnosis. NDVI is a strong early-season indicator of biomass and general vigour, but it can flatten out once a canopy closes in. That's where two other indices help: GNDVI, which is more sensitive to chlorophyll and nitrogen status, and NDRE, which uses the red edge band and keeps working later in the season when NDVI starts to lose sensitivity. The Mavic 3M's software can build all three from the same flight, so an agronomist isn't limited to one view of the field.

The Mavic 3M's RTK module also tags every image with centimetre-level position data. That means the map lines up precisely with the field boundary, and the same flight path can be repeated later to compare one date against another.

What the Maps Actually Reveal

Once a flight is processed into a map, a handful of patterns tend to stand out. None of these are automatic diagnoses on their own — they're patterns worth checking on the ground.

01

Wet spots and drainage

Low corners and old waterways hold moisture longer than the rest of the field. They show up as low-vigour zones that line up closely with elevation, and tend to repeat in the same spots year after year.

02

Emergence gaps

Planter skips, seed placement issues, or compaction from equipment traffic show up as thin or missing stands in the earliest flights of the season, well before they're visible walking the rows.

03

Stress zones

Nutrient shortfalls, early disease, and insect pressure can reduce how a canopy reflects light before visible symptoms appear. The map narrows down where to look; it doesn't name the cause on its own.

04

Uneven growth

Sandy knolls, heavy clay pockets, and old fence lines create yield variability that's easy to write off as "just how that corner is." A season of mapped data usually shows a clearer, repeatable pattern.

Aerial view showing contrasting green crops and tilled brown soil highlighting field variability
Variability like this is often visible once it's severe. Multispectral mapping catches the same pattern while it's still mild. Photo: Bernd Dittrich / Pexels

Why Drone Imagery Can Be More Timely Than Satellite

Satellite-based NDVI has been available to growers for years, and it's genuinely useful for a broad, season-long view. It needs no flight time and covers large areas automatically. But it comes with limits that a drone flight doesn't have.

SATELLITE Revisits every 5–16 days Blocked entirely by cloud cover Coarse resolution, 3–10 m per pixel Good for season-long trend tracking MAVIC 3M Flies whenever the field needs it Flies under cloud, unaffected by it Centimetre-level resolution Good for in-season, act-now decisions
The two aren't really competing. Satellite is best for the season-long trend line; drone is best for the decision you need to make this week. (Original diagram, Vantage Drones)

Manitoba's growing season doesn't leave much room for a five- to sixteen-day gap between clear satellite images, especially when the province regularly clouds over during the exact week a grower needs to check a field. A Mavic 3M flight happens on the operation's own schedule, and it resolves detail — a single planter pass, a small wet pocket, a compacted headland — well below what a satellite pixel can show. In practice, the two work well together: satellite for the broad, repeatable picture across an operation, and a drone flight when one field or one problem needs a closer look before a decision gets made.

From Map to Action: What a Map Is Actually For

A map on its own doesn't fix anything. Its value comes from what it changes about how a grower spends time and makes decisions — and this is where the Mavic 3M connects directly to the rest of a Vantage operation.

For growers running, or considering, the Agras spray fleet, an NDVI map becomes the prescription: stress zones and weed patches spotted from the air load directly into a variable-rate spray mission, so product goes only where the map says it's needed. For growers not spraying by drone yet, the same map still pays for itself. It turns a scouting trip into a targeted walk to two or three flagged coordinates, instead of a guess-and-check pass across the whole field.

Feeds spray prescriptions

NDVI output loads directly into a variable-rate spray mission for targeted application on the T25, T50, or T100.

Sharpens ground scouting

Turns a full-field walk into a short list of coordinates that are actually worth checking in person.

Builds a field record

Repeat flights on the same coordinates show whether a problem zone is improving, worsening, or holding steady year over year.

Documents field conditions

A dated, geotagged map is useful on its own for insurance conversations or agronomic records, separate from any spray decision.

You don't need to be ready to spray by drone to get value from flying one. Mapping is often the first step, and for a lot of Manitoba operations, it's the one that pays for itself fastest.

Common Mistakes When Using Drone Imagery

Most of the disappointment growers report with drone mapping comes down to a short list of avoidable mistakes, not the technology itself.

01

Assuming every colour difference means a crop problem. A field map shows variability, not automatically a diagnosis. Shadows, residue, soil type, and even the time of day a flight was taken can create differences that have nothing to do with plant health.

02

Treating an index map as a diagnosis. NDVI and similar indices flag where something is different. They don't identify disease, a nutrient gap, or moisture stress on their own — that call still needs a ground check.

03

Skipping the ground visit. A map is the start of the process, not the end of it. Skipping the walk defeats the point of narrowing down where to look in the first place.

04

Flying without a clear question. A flight with no specific purpose tends to produce a map that gets looked at once and forgotten. Mapping earns its value when there's something specific to check.

The DJI Mavic 3M at a Glance

The Mavic 3M is genuinely portable. It folds down small enough to fit in an ordinary field bag, and one operator can be airborne within minutes of pulling up to a field.

951 gTake-off weight (with RTK)
20 MPRGB camera resolution
4-bandG / R / Red Edge / NIR multispectral
~43 minMax flight time per battery
~200 haCoverage in a single flight
RTKCentimetre-level positioning

Specifications reflect DJI Agriculture manufacturer data for the Mavic 3 Multispectral Edition. Actual coverage per flight varies with altitude, overlap settings, and wind.

Because RGB and multispectral data are captured in the same pass, there's no need for a separate mapping flight. One mission over a field produces both the visual record and the vegetation-index data an agronomist needs to act on.

Buying the Mavic 3M in Canada

Growers who want to run mapping in-house, rather than booking a Vantage flight crew, can order a Mavic 3M through the Vantage Drones shop. It's listed at $5,945 and ships as a complete kit: the drone with its RTK module, a DJI RC Pro Industry controller, an intelligent flight battery with charging hub, propellers, a gimbal guard, and a quick start guide.

Larger operations sometimes add a D-RTK 2 Base Station for a fixed, high-accuracy reference point across a season of flights. It isn't required — the Mavic 3M's onboard RTK already supports mapping without ground control points — but it tightens repeatability for operations tracking the same coordinates flight after flight.

Flight data moves into DJI Terra or SmartFarm Web to build the NDVI, GNDVI, and NDRE maps, and from there into a variable-rate prescription — the same path that connects a Mavic 3M mapping flight to an Agras spray mission. As an authorized DJI Enterprise reseller, Vantage backs every unit sold in Canada with local warranty support, on-site training, and financing options for operations that would rather spread the cost across a season.

See What's Actually Happening in Your Fields

Book a mapping demo on your own acres, or talk to us about whether mapping or spraying is the right place to start.